Picture This:
You and your group of friends go out for coffee every weekend. Everyone usually orders a cappuccino for ₹150. But one week, someone shows up with a ₹500 matcha-latte-sprinkled-with-moon-dust. The bill soars, your wallet cries, and suddenly… your group’s “vibe” feels off. That, dear reader, is variance creeping in.
Let’s break it down like a drama between two highly sensitive friends:
🎭 Meet the Cast:
💁♀️ Variance
“I need to calculate how far off everyone is from the average mood in the room — and I’ll square their reactions to emphasize their extra-ness!”
What it does: Measures the average squared distance from the mean.
Why it’s dramatic: It squares every deviation. Small outbursts become big ones. One moody latte-ordering friend? The whole vibe is affected exponentially.
Formula:
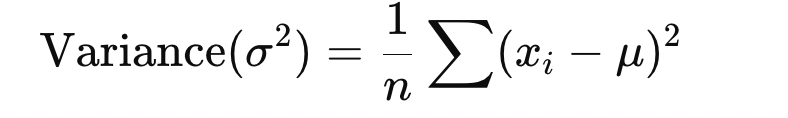
Units: If your data was in rupees, the variance is in rupees² — yeah, not very intuitive at dinner time.
👩💻 Standard Deviation
“Okay babe, let me calm things down. I’ll just take the square root of that chaos and translate it back into real-world terms.”
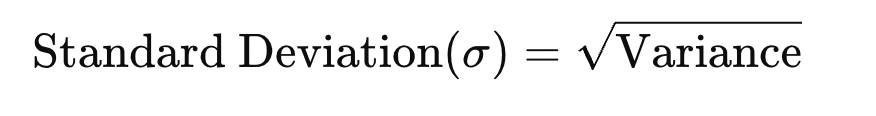
- What it does: Measures the average deviation from the mean — in the same units as your data.
- Why it’s cooler: It brings things back to reality. Easier to interpret. Less flair, more function.
- Formula:
🎨 Visual Metaphor: The Drama Scale
Mean (µ)
↓
|----x----x----x----x----x----|   ← Consistent moods = low variance

|--x--------------x-----x--x--|   ← Wild moods = high variance

Variance: Measures how much the mood swings
Std. Dev: Translates those swings into something you can *actually* understand
🧠 Quick Analogy: The Moody Friends
Variance is like the group therapist who documents everyone’s mood in excessive detail (even overreacts a little).
Standard Deviation is the chill mutual friend who says, “Yeah, things were kinda off this week. Here’s roughly how much.”
💡 When to Use What?
Variance is great for mathy stuff — like in optimization, machine learning, and statistics where squaring plays nice with equations.
Standard deviation is your go-to for interpretation. It answers: “How far do things typically stray from the average?”
🧪 A Tiny Example
Let’s say you’ve got two friend groups:
☕ Group A – The Chill Squad
Coffee prices they pay: ₹148, ₹150, ₹152
These folks are predictable. Maybe one gets almond milk sometimes. That’s it.
💸 Group B – The Wild Bunch
Prices: ₹100, ₹150, ₹200
One person orders espresso. One shows up with a designer matcha. One brings their own flask. Chaos.
Both groups have the same average coffee price: ₹150
But the spread of prices — the drama — is very different.
| Metric | Group A (Chill) | Group B (Wild) |
|---|---|---|
| Variance | 2.67 | 2,500 |
| Std. Deviation | 1.63 | 50.00 |
So what does this mean?
- Group A sticks close to the average – peaceful, low-stakes drama.
- Group B? One minute it’s espresso, the next it’s gold-dusted frappe. Wild swings. High standard deviation. High variance.
🎭 Final Thoughts – Which One’s the Bigger Diva?
- Variance is like that overly emotional friend who journals every tiny deviation with intensity. It’s accurate, but a bit… dramatic.
- Standard deviation is their calmer sibling — translating the chaos into something relatable. You won’t need a stats degree to understand what it’s saying.
So when you’re decoding a dataset, ask yourself:
“Do I want to feel the drama or just measure it?”
If you want intuition — go with standard deviation.
If you’re building models or playing with math — variance is your loyal (if melodramatic) sidekick.
P.S. Now that you know how the drama unfolds, meet the peacemaker that ties it all together — the Normal Distribution, a curve so beloved, it practically deserves its own fan club. Read why it’s everyone’s favourite →
1 thought on “Variance vs. Standard Deviation: The Drama Queens of Data”